BY Courtney Huckabay
Overall satisfaction with paid streaming video service is highest among cord stackers — customers who subscribe to a traditional cable/satellite service in addition to streaming video service — according to the J.D. Power 2016 Streaming Video Satisfaction Study.
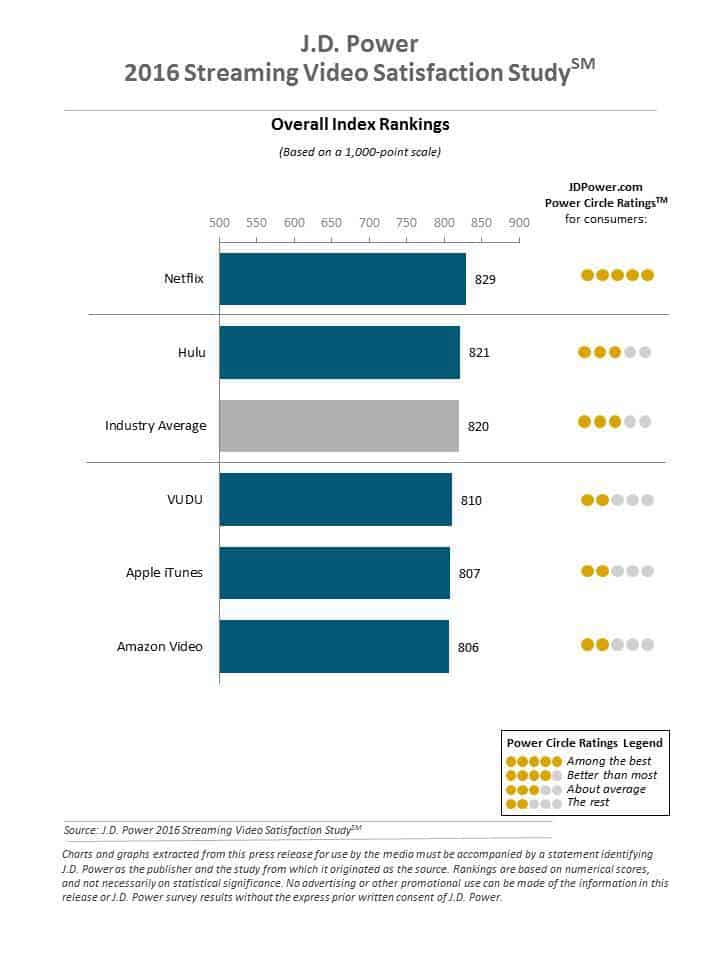
The inaugural study measures overall satisfaction among customers who have used a subscription- or transaction-based streaming video service within the past six months. The study measures customer satisfaction by examining six key measures (listed in order of importance): performance and reliability; content; cost of service; ease of use; communication; and customer service. Scores for each measure are reflected in an index based on a 1,000-point scale.
The study finds that although the number of customers who cut the cord on pay TV is growing, the majority of streaming video customers still purchase a paid TV service in addition to a streaming video service. Three-fifths (60%) of streaming customers are cord stackers; 23% are cord shavers (those who still subscribe to TV but have downgraded their service package); 13% are cord cutters (those who have recently canceled TV service); and 4% are cord nevers (those who have never subscribed to pay TV and only subscribe to streaming video service).
Consumers like to have it all – and they like to have it their way. Customization is the key to programming these days. Pick-and-choose packages should be promoted to Streaming Video Service Subscribers. The AudienceSCAN study found 39.2% of Streaming Video Service Subscribers get most of their television programming from cable subscriptions.
Following are some of the study’s key findings:
Satisfaction Lowest among Cord Cutters: Overall satisfaction is lowest among cord cutters (802), followed closely by cord nevers (807), while satisfaction is highest among cord stackers (826) and cord shavers (822). Satisfaction in all measures is lower among customers who do not have cable/satellite TV than among those who do, with an especially wide gap between the two segments in the content measure (40 points).
Local satellite dealers and installers can promote satisfaction levels among streamers. The AudienceSCAN survey revealed 25.1% of Streaming Video Service Subscribers get most of their television programming from satellite subscriptions (like DirecTV or DISH Network).
Binge-Watching High: Nearly two-thirds (62%) of customers use a streaming service to binge watch—the act of watching multiple episodes in succession—TV programming. Overall satisfaction is 35 points higher among those who binge watch vs. those who do not (834 vs. 799, respectively). As binge-watching sessions increase in duration, so does overall satisfaction: 823 among those whose most recent session lasted less than four hours; 841 among those whose session lasted 4–8 hours; and 858 among those whose session lasted 8 or more hours.
Original Content Viewership Higher among Streaming-Only Subscribers: More than half (54%) of cord nevers and 49% of cord cutters view original content vs. 43% of cord shavers and 41% of cord stackers.
Streamers WILL see television spots! 66% of Streaming Video Service Subscribers took action after watching TV commercials in the past year, according to AudienceSCAN survey results.
“The streaming video customer experience appears to be stratifying across the different subscriber segments, with pay TV service still having a major effect on the overall streaming video experience,” said Kirk Parsons, senior director and technology, media & telecom practice leader at J.D. Power. “Part of the reason is demographics. Customers who only stream are younger than those who also have TV. Nearly two-fifths (37%) of customers who only stream are 18–34 years old, compared with 30% of those who also have TV. Notably, 52% of cord nevers are 18–34. Also, streaming-only customers are less likely to use transaction-based streaming services, which perform higher in the content measure.”
AudienceSCAN data is available as part of a subscription to AdMall for Agencies, or with the SalesFuel API. Media companies can access AudienceSCAN data through the AudienceSCAN Reports in AdMall.