BY Courtney Huckabay
A new Beverage Marketing Corp. and Fluent survey shows taste, convenience and nutrition are the top preferences among college students, with bottled water as the big winner. Taught to make healthy choices from a young age, Gen Z college students take that lesson seriously when reaching for beverages.
Practicality and natural products are preferred –– while artificial ingredients and crazy fads are likely to cue a collective eye–roll –– as determined by a new survey from industry consultants Beverage Marketing Corporation and Fluent, a leading college marketing and insights agency. The survey of undergraduates offers clear direction to those who make, distribute and sell beverages to Gen Z: keep it simple and know your niche.
AudienceSCAN reports 53.6% of adults enjoy bottled water at least once during a typical week.
"From early–kindergarten lectures to constant health–related headlines on their phones, this generation knows about having to proactively make their own choices and not just take things at face value," said Fluent EVP Michael Carey. "And while they reach for water first, there are opportunities for other beverages to fill niche roles, if they know where to look."
13.2% of Bottled Water Drinkers are aged 18 to 24, AudienceSCAN found.
"As Gen Z matures, there are exciting opportunities for our industry to engage with these consumers in a positive way," said Beverage Marketing Corporation Chairman and CEO Michael Bellas. "We look forward to sharing how companies can reinforce strengths and create new experiences by listening to what this newest and typically hard–to–access audience has to say."
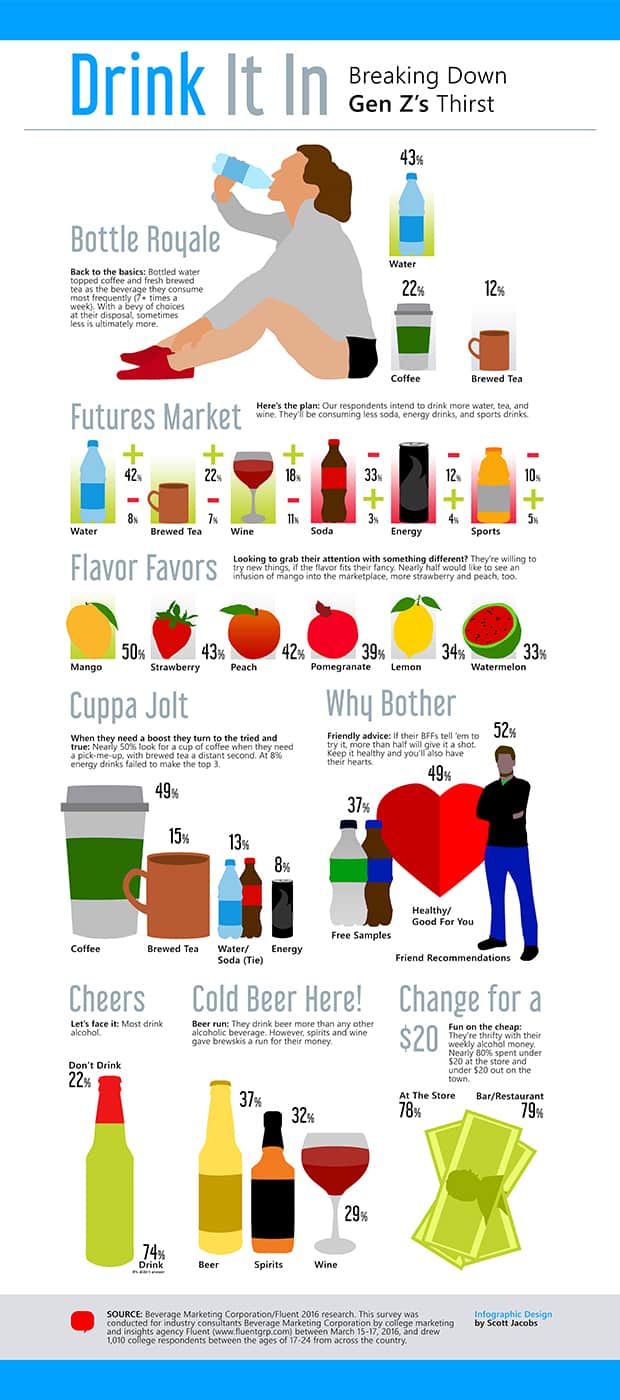
Top Picks and Consumption Trends –– Water Rules!
- Bottled water is THE top beverage purchase – 43% consume it 7+ times per week, with coffee (hot or iced, not specialty) next at 22%. Brewed tea was third at 12% in that category, and then beer at 9%. Hydration/thirst was the number one reason students pick up something to drink.
- Asked about future consumption, 42% plan to drink more bottled water and only 8% less of it, and 22% of students expect to drink more brewed tea, against 7% saying less. Barring significant innovation, soda is likely to continue its decline, with 33% planning to drink less against 3% to drink more. This correlates with recent data from BMC that finds bottled water is the second most popular beverage in the U.S., likely to overtake carbonated soft drinks' supremacy late 2016 or in 2017.
- While they find bottled water tastes better than tap water, 59% try to fill up water bottles and/or use a filtered water system on a regular basis. Still, nearly 20% of students rely solely on bottled water over tap or filtered, for many of the same reasons bottled water scores over other non–alcoholic beverages: It's healthier, more convenient and easier to find.
AudienceSCAN found the theme of health to be true as well. 53.7% of Bottled Water Drinkers set personal goals to eat healthier this year.
Purchase Decision Drivers – What's On the Label, Friend Recommendations
- Students read labels, 43% regularly and 38% at least sometimes. The top three descriptors influencing purchase are "all–natural" (52%), "low–calorie" (37%), and to a lesser extent, "organic" (36%), with "vitamin–enhanced" at 31% and "zero–calorie" at 27%.
- Around half of all students say they try to avoid artificial sweeteners, flavoring, preservatives, and high–fructose corn syrup. The sweetener they are most okay with is cane sugar (55%).
- The top reasons they try beverages? Students cite friends' picks (52%), "healthy/good for you" (49%), free samples (37%), interesting flavors (36%) and sale/ promotions (25%).
Offering a coupon could be the way to get these Bottled Water Drinkers in stores. During the past 30 days, 46.4% have used the internet via browser, tablet or smartphone to find coupons or discount codes.
Habits by Select Categories – Practicality, Baby!
- Sports drinks have clear roles. 37% of respondents drink them for hydration and recovery, 14% drink them for taste, and 13% to quench their thirst. They drink them most often while working out (54%) vs. before or after, to combat hangovers (46%), then because they are thirsty (45%).
- Pick–me–up choices were campus classics. The top go–to beverage was coffee at 49%, and then brewed tea at 15%. Water tied for third at 13% with soda, which seems to be a key messaging opportunity for carbonated soft drinks – ahead of energy drinks (8%).
Alcohol Highlights – Picky Preferences
- 74% of respondents say they do consume alcohol and 81% of those do drink beer on occasion. Asked what they prefer most, beer had a slight edge, with it, wine and spirits somewhat equal.
- When it comes to mixers, students reach first for soda (37%), and then juice (35%), followed by seltzers (10%).
AudienceSCAN data is available as part of a subscription to AdMall for Agencies, or with the SalesFuel API. Media companies can access AudienceSCAN data through the AudienceSCAN Reports in AdMall.